White-necked Heron
Ardea pacifica
ABR description
The following is extracted from the Annual Bird Report for the twelve months to June 2017.
Uncommon, breeding visitor
Occasionally seen in and around local bodies of water.
General: Reporting rate (1.2%) up 18% on last year but down 21% on the 30YA. Number of birds observed (286) considerably above last year (172), the 10YA (148) and the 30YA (67). Most records were expectedly of 1 or 2 birds (mean 1.7, median 1). Max 50/15 Feb Wollogorang Lagoon GrU03 (LeM1). Most records were in summer (65%) and autumn (20%), with fewer in winter (12%) and surprisingly few in spring (4%). This is unlike the long term seasonal figures where typically most sightings are in spring (44%). No breeding recorded; breeding only recorded in 1996, 1997 and 2014.
GBS: 9 records from 6 sites is well up on last year, similar to the 10YA and 30YA. Abundance a little below the record highs of 2014 and 2015. Records were from Carwoola and Burra, and from Ainslie, Curtin and Jerrabomberra.

Abundance
Abundance is the average number of birds of that species per survey. Where the species was observed (presence recorded) but the number of birds seen was not recorded, this is treated as a count of zero.
Abundance by year
This chart shows the abundance of White-necked Heron between 1982 and 2017. 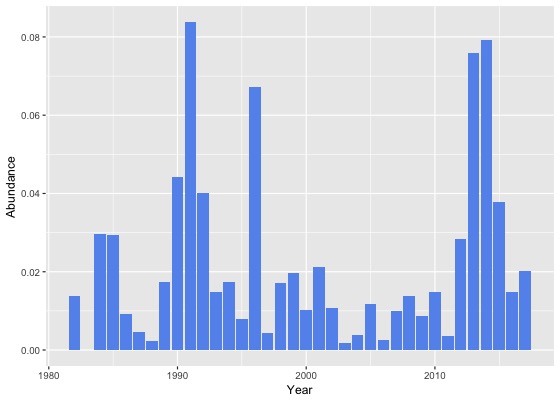
Abundance by month
This chart shows the monthly abundance of White-necked Heron. The blue lines show the abundance for the twelve months to June 2017 and the bars show the average abundance for the period 1982 to 2017. 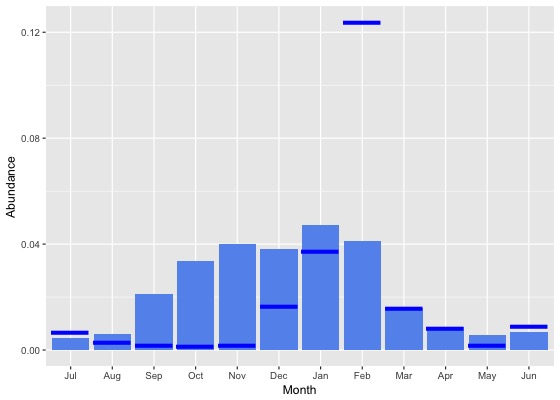
Abundance by season
This chart shows the seasonal abundance of White-necked Heron. The blue lines show the seasonal abundance for the twelve months to June 2017 and the bars show the average seasonal abundance for the period 1982 to 2017. 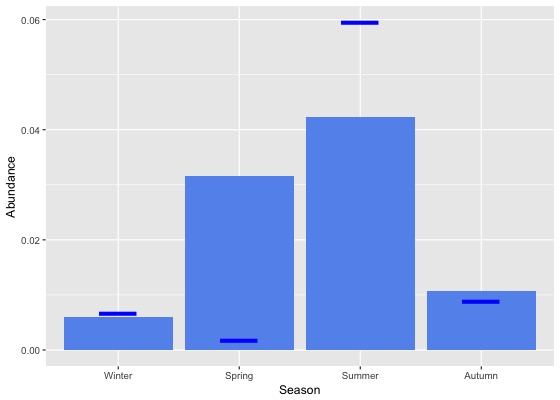
Abundance data
| Month | Season | ||||||||||||||||||
|---|---|---|---|---|---|---|---|---|---|---|---|---|---|---|---|---|---|---|---|
| Period | Jul | Aug | Sep | Oct | Nov | Dec | Jan | Feb | Mar | Apr | May | Jun | Winter | Spring | Summer | Autumn | All | ||
| All years | |||||||||||||||||||
| All | 0.0 | 0.0 | 0.0 | 0.0 | 0.0 | 0.0 | 0.0 | 0.0 | 0.0 | 0.0 | 0.0 | 0.0 | 0.0 | 0.0 | 0.0 | 0.0 | 0.0 | ||
| Previous years | |||||||||||||||||||
| All previous years | 0.0 | 0.0 | 0.0 | 0.0 | 0.0 | 0.0 | 0.0 | 0.0 | 0.0 | 0.0 | 0.0 | 0.0 | 0.0 | 0.0 | 0.0 | 0.0 | 0.0 | ||
| Previous 30 years | 0.0 | 0.0 | 0.0 | 0.0 | 0.0 | 0.0 | 0.0 | 0.0 | 0.0 | 0.0 | 0.0 | 0.0 | 0.0 | 0.0 | 0.0 | 0.0 | 0.0 | ||
| Previous 20 years | 0.0 | 0.0 | 0.0 | 0.0 | 0.1 | 0.0 | 0.0 | 0.0 | 0.0 | 0.0 | 0.0 | 0.0 | 0.0 | 0.0 | 0.0 | 0.0 | 0.0 | ||
| 10 year groups | |||||||||||||||||||
| [2007,2017) | 0.0 | 0.0 | 0.0 | 0.0 | 0.1 | 0.1 | 0.0 | 0.0 | 0.0 | 0.0 | 0.0 | 0.0 | 0.0 | 0.1 | 0.0 | 0.0 | 0.0 | ||
| [1997,2007) | 0.0 | 0.0 | 0.0 | 0.0 | 0.0 | 0.0 | 0.0 | 0.0 | 0.0 | 0.0 | 0.0 | 0.0 | 0.0 | 0.0 | 0.0 | 0.0 | 0.0 | ||
| [1987,1997) | 0.0 | 0.0 | 0.0 | 0.0 | 0.0 | 0.0 | 0.1 | 0.0 | 0.0 | 0.0 | 0.0 | 0.0 | 0.0 | 0.0 | 0.1 | 0.0 | 0.0 | ||
| 5 year groups | |||||||||||||||||||
| [2012,2017) | 0.0 | 0.0 | 0.0 | 0.1 | 0.1 | 0.1 | 0.1 | 0.0 | 0.0 | 0.0 | 0.0 | 0.0 | 0.0 | 0.1 | 0.1 | 0.0 | 0.0 | ||
| [2007,2012) | 0.0 | 0.0 | 0.0 | 0.0 | 0.0 | 0.0 | 0.0 | 0.0 | 0.0 | 0.0 | 0.0 | 0.0 | 0.0 | 0.0 | 0.0 | 0.0 | 0.0 | ||
| [2002,2007) | 0.0 | 0.0 | 0.0 | 0.0 | 0.0 | 0.0 | 0.0 | 0.0 | 0.0 | 0.0 | 0.0 | 0.0 | 0.0 | 0.0 | 0.0 | 0.0 | 0.0 | ||
| [1997,2002) | 0.0 | 0.0 | 0.0 | 0.0 | 0.0 | 0.0 | 0.0 | 0.0 | 0.1 | 0.0 | 0.0 | 0.0 | 0.0 | 0.0 | 0.0 | 0.0 | 0.0 | ||
| [1992,1997) | 0.0 | 0.0 | 0.0 | 0.1 | 0.0 | 0.1 | 0.1 | 0.0 | 0.0 | 0.0 | 0.0 | 0.0 | 0.0 | 0.0 | 0.1 | 0.0 | 0.0 | ||
| [1987,1992) | 0.0 | 0.0 | 0.0 | 0.0 | 0.0 | 0.0 | 0.1 | 0.0 | 0.0 | 0.0 | 0.0 | 0.0 | 0.0 | 0.0 | 0.1 | 0.0 | 0.0 | ||
| Year | |||||||||||||||||||
| 2017 | 0.0 | 0.0 | 0.0 | 0.0 | 0.0 | 0.0 | 0.0 | 0.1 | 0.0 | 0.0 | 0.0 | 0.0 | 0.0 | 0.0 | 0.1 | 0.0 | 0.0 | ||
| 2016 | 0.0 | 0.0 | 0.0 | 0.1 | 0.0 | 0.0 | 0.0 | 0.0 | 0.0 | 0.0 | 0.0 | 0.0 | 0.0 | 0.0 | 0.0 | 0.0 | 0.0 | ||
| 2015 | 0.0 | 0.0 | 0.0 | 0.1 | 0.1 | 0.0 | 0.0 | 0.0 | 0.0 | 0.0 | 0.0 | 0.0 | 0.0 | 0.1 | 0.0 | 0.0 | 0.0 | ||
| 2014 | 0.0 | 0.0 | 0.2 | 0.0 | 0.2 | 0.2 | 0.2 | 0.0 | 0.0 | 0.0 | 0.0 | 0.0 | 0.0 | 0.1 | 0.1 | 0.0 | 0.1 | ||
| 2013 | 0.0 | 0.0 | 0.0 | 0.1 | 0.2 | 0.2 | 0.1 | 0.1 | 0.0 | 0.0 | 0.0 | 0.0 | 0.0 | 0.1 | 0.1 | 0.0 | 0.1 | ||
| 2012 | 0.0 | 0.0 | 0.0 | 0.1 | 0.1 | 0.0 | 0.0 | 0.0 | 0.0 | 0.0 | 0.0 | 0.0 | 0.0 | 0.1 | 0.0 | 0.0 | 0.0 | ||
| 2011 | 0.0 | 0.0 | 0.0 | 0.0 | 0.0 | 0.0 | 0.0 | 0.0 | 0.0 | 0.0 | 0.0 | 0.0 | 0.0 | 0.0 | 0.0 | 0.0 | 0.0 | ||
| 2010 | 0.0 | 0.0 | 0.0 | 0.0 | 0.0 | 0.0 | 0.0 | 0.0 | 0.0 | 0.0 | 0.0 | 0.0 | 0.0 | 0.0 | 0.0 | 0.0 | 0.0 | ||
| 2009 | 0.0 | 0.0 | 0.0 | 0.0 | 0.0 | 0.0 | 0.0 | 0.0 | 0.0 | 0.0 | 0.0 | 0.0 | 0.0 | 0.0 | 0.0 | 0.0 | 0.0 | ||
| 2008 | 0.0 | 0.0 | 0.1 | 0.0 | 0.0 | 0.0 | 0.0 | 0.0 | 0.0 | 0.0 | 0.0 | 0.0 | 0.0 | 0.0 | 0.0 | 0.0 | 0.0 | ||
| 2007 | 0.0 | 0.0 | 0.0 | 0.0 | 0.0 | 0.0 | 0.0 | 0.0 | 0.0 | 0.0 | 0.0 | 0.0 | 0.0 | 0.0 | 0.0 | 0.0 | 0.0 | ||
| 2006 | 0.0 | 0.0 | 0.0 | 0.0 | 0.0 | 0.0 | 0.0 | 0.0 | 0.0 | 0.0 | 0.0 | 0.0 | 0.0 | 0.0 | 0.0 | 0.0 | 0.0 | ||
| 2005 | 0.0 | 0.0 | 0.0 | 0.0 | 0.0 | 0.1 | 0.0 | 0.0 | 0.0 | 0.0 | 0.0 | 0.0 | 0.0 | 0.0 | 0.0 | 0.0 | 0.0 | ||
| 2004 | 0.0 | 0.0 | 0.0 | 0.0 | 0.0 | 0.0 | 0.0 | 0.0 | 0.0 | 0.0 | 0.0 | 0.0 | 0.0 | 0.0 | 0.0 | 0.0 | 0.0 | ||
| 2003 | 0.0 | 0.0 | 0.0 | 0.0 | 0.0 | 0.0 | 0.0 | 0.0 | 0.0 | 0.0 | 0.0 | 0.0 | 0.0 | 0.0 | 0.0 | 0.0 | 0.0 | ||
| 2002 | 0.0 | 0.0 | 0.0 | 0.0 | 0.0 | 0.0 | 0.0 | 0.0 | 0.0 | 0.0 | 0.0 | 0.0 | 0.0 | 0.0 | 0.0 | 0.0 | 0.0 | ||
| 2001 | 0.0 | 0.0 | 0.0 | 0.0 | 0.0 | 0.0 | 0.0 | 0.0 | 0.1 | 0.0 | 0.0 | 0.0 | 0.0 | 0.0 | 0.0 | 0.1 | 0.0 | ||
| 2000 | 0.0 | 0.0 | 0.0 | 0.0 | 0.0 | 0.0 | 0.0 | 0.0 | 0.0 | 0.0 | 0.0 | 0.0 | 0.0 | 0.0 | 0.0 | 0.0 | 0.0 | ||
| 1999 | 0.0 | 0.0 | 0.0 | 0.0 | 0.0 | 0.0 | 0.1 | 0.1 | 0.0 | 0.0 | 0.0 | 0.0 | 0.0 | 0.0 | 0.1 | 0.0 | 0.0 | ||
| 1998 | 0.0 | 0.0 | 0.0 | 0.0 | 0.0 | 0.0 | 0.0 | 0.0 | 0.0 | 0.0 | 0.0 | 0.0 | 0.0 | 0.0 | 0.0 | 0.0 | 0.0 | ||
| 1997 | 0.0 | 0.0 | 0.0 | 0.0 | 0.0 | 0.0 | 0.0 | 0.0 | 0.0 | 0.0 | 0.0 | 0.0 | 0.0 | 0.0 | 0.0 | 0.0 | 0.0 | ||
| 1996 | 0.0 | 0.0 | 0.0 | 0.2 | 0.1 | 0.2 | 0.1 | 0.0 | 0.0 | 0.1 | 0.0 | 0.0 | 0.0 | 0.1 | 0.1 | 0.0 | 0.1 | ||
| 1995 | 0.0 | 0.0 | 0.0 | 0.0 | 0.0 | 0.0 | 0.0 | 0.0 | 0.0 | 0.0 | 0.0 | 0.0 | 0.0 | 0.0 | 0.0 | 0.0 | 0.0 | ||
| 1994 | 0.0 | 0.0 | 0.0 | 0.0 | 0.0 | 0.0 | 0.1 | 0.0 | 0.0 | 0.0 | 0.0 | 0.0 | 0.0 | 0.0 | 0.1 | 0.0 | 0.0 | ||
| 1993 | 0.0 | 0.0 | 0.0 | 0.0 | 0.0 | 0.0 | 0.0 | 0.0 | 0.0 | 0.0 | 0.0 | 0.0 | 0.0 | 0.0 | 0.0 | 0.0 | 0.0 | ||
| 1992 | 0.0 | 0.0 | 0.1 | 0.0 | 0.1 | 0.0 | 0.1 | 0.0 | 0.1 | 0.1 | 0.1 | 0.0 | 0.0 | 0.1 | 0.0 | 0.1 | 0.0 | ||
| 1991 | 0.0 | 0.0 | 0.0 | 0.0 | 0.0 | 0.2 | 0.9 | 0.1 | 0.0 | 0.0 | 0.0 | 0.0 | 0.0 | 0.0 | 0.4 | 0.0 | 0.1 | ||
| 1990 | 0.0 | 0.0 | 0.0 | 0.1 | 0.0 | 0.0 | 0.3 | 0.2 | 0.0 | 0.0 | 0.0 | 0.0 | 0.0 | 0.0 | 0.2 | 0.0 | 0.0 | ||
| 1989 | 0.0 | 0.0 | 0.0 | 0.0 | 0.0 | 0.1 | 0.0 | 0.0 | 0.0 | 0.0 | 0.0 | 0.0 | 0.0 | 0.0 | 0.0 | 0.0 | 0.0 | ||
| 1988 | 0.0 | 0.0 | 0.0 | 0.0 | 0.0 | 0.0 | 0.0 | 0.0 | 0.0 | 0.0 | 0.0 | 0.0 | 0.0 | 0.0 | 0.0 | 0.0 | 0.0 | ||
| 1987 | 0.0 | 0.0 | 0.0 | 0.0 | 0.0 | 0.0 | 0.0 | 0.0 | 0.0 | 0.0 | 0.0 | 0.0 | 0.0 | 0.0 | 0.0 | 0.0 | 0.0 | ||
| 1986 | 0.0 | 0.0 | 0.0 | 0.0 | 0.0 | 0.0 | 0.0 | 0.0 | 0.0 | 0.0 | 0.0 | 0.0 | 0.0 | 0.0 | 0.0 | 0.0 | 0.0 | ||
| 1985 | 0.1 | 0.0 | 0.0 | 0.0 | 0.0 | 0.0 | 0.2 | 0.2 | 0.0 | 0.1 | 0.2 | 0.0 | 0.0 | 0.0 | 0.1 | 0.1 | 0.0 | ||
| 1984 | 0.0 | 0.0 | 0.0 | 0.0 | 0.2 | 0.0 | 0.0 | 0.2 | 0.0 | 0.0 | 0.0 | 0.0 | 0.0 | 0.0 | 0.1 | 0.0 | 0.0 | ||
| 1983 | 0.0 | 0.0 | 0.0 | 0.0 | 0.0 | 0.0 | 0.0 | 0.0 | 0.0 | - | 0.0 | 0.0 | 0.0 | 0.0 | 0.0 | 0.0 | 0.0 | ||
| 1982 | - | 0.0 | - | 0.0 | 0.0 | 0.0 | - | 0.1 | - | 0.0 | - | 0.0 | 0.0 | 0.0 | 0.0 | 0.0 | 0.0 | ||
Reporting rates
Reporting rate is the proportion of all surveys in which the species was present.
Reporting rate by year
This chart shows the reporting rate of White-necked Heron each year between 1982 and 2017. 
Reporting rate by month
This chart shows the reporting rate by month of White-necked Heron. The blue lines show the reporting rate for the twelve months to June 2017 and the bars show the average reporting rate for the period 1982 to 2017. 
Reporting rate by season
This chart shows the seasonal reporting rate of White-necked Heron. The blue lines show the seasonal reporting rate for the twelve months to June 2017 and the bars show the average seasonal reporting rate for the period 1982 to 2017. 
Reporting rate data
| Month | Season | ||||||||||||||||||
|---|---|---|---|---|---|---|---|---|---|---|---|---|---|---|---|---|---|---|---|
| Period | Jul | Aug | Sep | Oct | Nov | Dec | Jan | Feb | Mar | Apr | May | Jun | Winter | Spring | Summer | Autumn | All | ||
| All years | |||||||||||||||||||
| All | 0.5 | 0.5 | 1.2 | 1.9 | 2.7 | 2.3 | 2.3 | 2.0 | 1.0 | 0.8 | 0.5 | 0.6 | 0.5 | 1.9 | 2.2 | 0.8 | 1.4 | ||
| Previous years | |||||||||||||||||||
| All previous years | 0.5 | 0.5 | 1.3 | 2.1 | 3.1 | 2.5 | 2.3 | 1.3 | 0.9 | 0.8 | 0.6 | 0.5 | 0.5 | 2.1 | 2.1 | 0.8 | 1.5 | ||
| Previous 30 years | 0.5 | 0.5 | 1.4 | 2.1 | 3.2 | 2.5 | 2.3 | 1.3 | 0.9 | 0.7 | 0.6 | 0.5 | 0.5 | 2.2 | 2.1 | 0.7 | 1.5 | ||
| Previous 20 years | 0.6 | 0.6 | 1.4 | 2.3 | 3.7 | 2.4 | 2.2 | 1.2 | 0.8 | 0.7 | 0.6 | 0.6 | 0.6 | 2.4 | 2.0 | 0.7 | 1.5 | ||
| 10 year groups | |||||||||||||||||||
| [2007,2017) | 0.7 | 0.8 | 1.8 | 2.6 | 4.8 | 3.1 | 2.3 | 1.2 | 0.9 | 0.8 | 0.7 | 0.8 | 0.8 | 2.9 | 2.3 | 0.8 | 1.8 | ||
| [1997,2007) | 0.4 | 0.2 | 0.7 | 1.1 | 1.3 | 1.1 | 1.6 | 1.3 | 0.7 | 0.5 | 0.3 | 0.2 | 0.2 | 1.0 | 1.3 | 0.5 | 0.8 | ||
| [1987,1997) | 0.2 | 0.2 | 1.0 | 1.1 | 1.4 | 3.1 | 3.0 | 1.5 | 1.0 | 0.9 | 0.5 | 0.2 | 0.2 | 1.2 | 2.6 | 0.8 | 1.2 | ||
| 5 year groups | |||||||||||||||||||
| [2012,2017) | 0.5 | 0.9 | 1.8 | 3.3 | 5.9 | 4.0 | 2.7 | 1.3 | 1.0 | 1.1 | 1.0 | 1.1 | 0.9 | 3.5 | 2.7 | 1.0 | 2.2 | ||
| [2007,2012) | 1.3 | 0.5 | 1.8 | 1.6 | 1.9 | 1.3 | 1.0 | 0.9 | 0.5 | 0.1 | 0.0 | 0.2 | 0.6 | 1.7 | 1.1 | 0.2 | 1.0 | ||
| [2002,2007) | 0.6 | 0.2 | 0.7 | 0.9 | 1.1 | 0.8 | 0.8 | 0.5 | 0.4 | 0.4 | 0.5 | 0.3 | 0.4 | 0.9 | 0.7 | 0.4 | 0.6 | ||
| [1997,2002) | 0.0 | 0.2 | 0.7 | 1.4 | 1.5 | 1.4 | 2.4 | 2.1 | 1.1 | 0.5 | 0.0 | 0.0 | 0.1 | 1.2 | 1.9 | 0.6 | 1.0 | ||
| [1992,1997) | 0.3 | 0.2 | 2.0 | 2.1 | 2.8 | 2.9 | 3.6 | 0.4 | 0.9 | 1.4 | 0.8 | 0.0 | 0.2 | 2.3 | 2.5 | 1.0 | 1.5 | ||
| [1987,1992) | 0.1 | 0.3 | 0.5 | 0.6 | 0.8 | 3.2 | 2.7 | 1.9 | 1.1 | 0.7 | 0.3 | 0.3 | 0.2 | 0.6 | 2.6 | 0.7 | 1.0 | ||
| Year | |||||||||||||||||||
| 2017 | 0.7 | 0.3 | 0.2 | 0.1 | 0.2 | 1.3 | 2.2 | 4.9 | 1.5 | 0.7 | 0.2 | 0.8 | 0.6 | 0.2 | 2.8 | 0.8 | 1.2 | ||
| 2016 | 0.3 | 0.5 | 0.7 | 2.3 | 2.8 | 2.2 | 0.3 | 0.3 | 0.1 | 1.0 | 0.8 | 0.5 | 0.5 | 1.9 | 0.8 | 0.6 | 1.0 | ||
| 2015 | 1.2 | 1.8 | 2.3 | 5.5 | 6.4 | 3.5 | 1.5 | 1.1 | 2.1 | 0.7 | 0.9 | 0.9 | 1.2 | 4.8 | 2.0 | 1.3 | 2.5 | ||
| 2014 | 0.6 | 0.8 | 3.6 | 1.9 | 5.2 | 5.3 | 6.1 | 2.4 | 2.4 | 2.3 | 1.5 | 3.4 | 2.0 | 3.1 | 4.9 | 2.1 | 3.2 | ||
| 2013 | 0.0 | 0.9 | 2.6 | 3.3 | 11.5 | 7.0 | 6.8 | 3.8 | 1.0 | 1.6 | 2.1 | 1.1 | 0.7 | 5.4 | 6.2 | 1.4 | 4.0 | ||
| 2012 | 0.0 | 0.4 | 1.0 | 3.2 | 6.3 | 3.5 | 1.3 | 0.5 | 0.0 | 0.0 | 0.0 | 0.3 | 0.2 | 3.3 | 1.9 | 0.0 | 1.7 | ||
| 2011 | 0.8 | 0.8 | 1.2 | 0.4 | 0.6 | 0.3 | 0.3 | 0.5 | 0.0 | 0.3 | 0.0 | 0.0 | 0.3 | 0.7 | 0.3 | 0.1 | 0.4 | ||
| 2010 | 1.0 | 0.0 | 3.7 | 2.1 | 1.9 | 3.6 | 0.5 | 1.2 | 0.0 | 0.4 | 0.0 | 0.4 | 0.4 | 2.5 | 2.1 | 0.2 | 1.5 | ||
| 2009 | 0.7 | 0.0 | 1.1 | 0.9 | 2.2 | 0.5 | 2.7 | 3.3 | 1.9 | 0.0 | 0.0 | 0.0 | 0.2 | 1.3 | 2.0 | 0.7 | 1.1 | ||
| 2008 | 2.1 | 0.9 | 1.9 | 2.1 | 1.3 | 0.5 | 0.8 | 0.0 | 0.0 | 0.0 | 0.0 | 0.5 | 1.1 | 1.9 | 0.4 | 0.0 | 1.0 | ||
| 2007 | 2.2 | 0.9 | 0.8 | 2.5 | 3.4 | 1.3 | 1.6 | 0.0 | 0.9 | 0.0 | 0.0 | 0.3 | 0.8 | 2.2 | 1.2 | 0.3 | 1.2 | ||
| 2006 | 0.0 | 0.0 | 0.0 | 0.0 | 0.0 | 0.0 | 0.6 | 0.7 | 0.6 | 0.0 | 0.7 | 0.4 | 0.2 | 0.0 | 0.4 | 0.5 | 0.2 | ||
| 2005 | 0.0 | 0.0 | 0.7 | 1.1 | 1.4 | 1.6 | 0.7 | 2.2 | 0.4 | 0.0 | 0.0 | 0.4 | 0.2 | 1.0 | 1.4 | 0.2 | 0.7 | ||
| 2004 | 0.8 | 0.7 | 1.0 | 0.6 | 0.0 | 0.5 | 0.0 | 0.0 | 0.0 | 0.0 | 0.0 | 0.6 | 0.7 | 0.5 | 0.2 | 0.0 | 0.4 | ||
| 2003 | 0.9 | 0.0 | 0.4 | 0.5 | 0.5 | 0.4 | 0.0 | 0.0 | 0.0 | 0.9 | 0.0 | 0.0 | 0.2 | 0.5 | 0.2 | 0.4 | 0.3 | ||
| 2002 | 1.1 | 0.0 | 1.5 | 2.6 | 3.5 | 1.2 | 2.5 | 0.0 | 0.9 | 1.2 | 2.4 | 0.0 | 0.4 | 2.5 | 1.2 | 1.3 | 1.4 | ||
| 2001 | 0.0 | 0.0 | 1.2 | 1.3 | 1.1 | 0.0 | 1.0 | 1.5 | 0.9 | 0.5 | 0.0 | 0.0 | 0.0 | 1.2 | 0.7 | 0.6 | 0.7 | ||
| 2000 | 0.0 | 0.7 | 0.9 | 1.3 | 1.4 | 1.7 | 1.2 | 2.9 | 1.2 | 0.4 | 0.0 | 0.0 | 0.2 | 1.2 | 1.9 | 0.7 | 1.1 | ||
| 1999 | 0.0 | 0.0 | 0.6 | 1.3 | 0.0 | 1.2 | 7.3 | 3.6 | 2.2 | 0.5 | 0.0 | 0.0 | 0.0 | 0.6 | 3.9 | 0.9 | 1.4 | ||
| 1998 | 0.0 | 0.0 | 0.0 | 2.2 | 3.5 | 4.7 | 1.5 | 0.0 | 0.0 | 2.6 | 0.0 | 0.0 | 0.0 | 1.8 | 2.6 | 0.6 | 1.5 | ||
| 1997 | 0.0 | 0.0 | 0.0 | 1.3 | 2.6 | 1.0 | 2.0 | 0.0 | 0.0 | 0.0 | 0.0 | 0.0 | 0.0 | 1.3 | 0.9 | 0.0 | 0.6 | ||
| 1996 | 0.0 | 0.0 | 4.0 | 5.3 | 3.7 | 7.1 | 4.9 | 0.0 | 1.0 | 1.6 | 0.0 | 0.0 | 0.0 | 4.4 | 4.2 | 0.9 | 2.6 | ||
| 1995 | 0.0 | 0.0 | 0.0 | 0.6 | 2.7 | 1.1 | 0.9 | 0.0 | 0.0 | 0.8 | 0.0 | 0.0 | 0.0 | 1.1 | 0.8 | 0.3 | 0.6 | ||
| 1994 | 0.0 | 0.0 | 1.5 | 1.2 | 1.5 | 0.0 | 5.9 | 1.7 | 0.0 | 0.0 | 0.0 | 0.0 | 0.0 | 1.4 | 2.9 | 0.0 | 0.9 | ||
| 1993 | 2.0 | 1.3 | 3.2 | 2.7 | 1.5 | 2.2 | 2.0 | 0.0 | 0.0 | 0.0 | 0.0 | 0.0 | 1.0 | 2.5 | 1.6 | 0.0 | 1.2 | ||
| 1992 | 0.0 | 0.0 | 2.4 | 1.1 | 5.6 | 1.6 | 5.2 | 0.0 | 4.2 | 6.8 | 3.9 | 0.0 | 0.0 | 2.8 | 2.5 | 4.9 | 2.6 | ||
| 1991 | 0.0 | 0.0 | 0.0 | 0.0 | 2.1 | 12.2 | 14.3 | 4.0 | 1.6 | 0.0 | 1.6 | 2.0 | 0.4 | 0.7 | 10.6 | 1.1 | 2.6 | ||
| 1990 | 0.0 | 0.0 | 0.0 | 1.0 | 0.0 | 2.8 | 8.3 | 4.2 | 2.3 | 2.4 | 0.0 | 1.3 | 0.2 | 0.3 | 5.1 | 1.6 | 1.4 | ||
| 1989 | 0.0 | 0.9 | 0.9 | 1.5 | 2.5 | 5.7 | 1.6 | 1.5 | 2.2 | 0.5 | 0.7 | 0.0 | 0.3 | 1.6 | 3.1 | 1.1 | 1.6 | ||
| 1988 | 0.4 | 0.0 | 0.0 | 0.4 | 0.3 | 0.0 | 0.5 | 0.0 | 0.5 | 0.5 | 0.0 | 0.0 | 0.1 | 0.3 | 0.2 | 0.3 | 0.2 | ||
| 1987 | 0.0 | 0.0 | 0.8 | 0.0 | 0.0 | 0.5 | 0.5 | 2.5 | 0.0 | 0.4 | 0.0 | 0.0 | 0.0 | 0.2 | 1.2 | 0.1 | 0.5 | ||
| 1986 | 0.0 | 0.0 | 0.0 | 0.0 | 0.0 | 0.0 | 4.3 | 0.0 | 3.2 | 3.9 | 0.0 | 0.0 | 0.0 | 0.0 | 1.1 | 2.7 | 0.9 | ||
| 1985 | 3.3 | 0.0 | 0.0 | 0.0 | 0.0 | 1.7 | 25.0 | 17.6 | 0.0 | 5.3 | 10.0 | 3.6 | 2.3 | 0.0 | 7.1 | 5.0 | 2.5 | ||
| 1984 | 0.0 | 0.0 | 0.0 | 0.0 | 25.0 | 0.0 | 0.0 | 3.0 | 0.0 | 2.9 | 0.0 | 0.0 | 0.0 | 4.8 | 1.4 | 1.1 | 1.3 | ||
| 1983 | 0.0 | 0.0 | 0.0 | 0.0 | 0.0 | 0.0 | 0.0 | 0.0 | 0.0 | - | 0.0 | 0.0 | 0.0 | 0.0 | 0.0 | 0.0 | 0.0 | ||
| 1982 | - | 0.0 | - | 0.0 | 0.0 | 0.0 | - | 9.1 | - | 0.0 | - | 0.0 | 0.0 | 0.0 | 4.0 | 0.0 | 1.4 | ||
Breeding data
Breeding records by month
Number of breeding records by breeding code and month, 2017 and all years| Breeding code | Jul | Aug | Sep | Oct | Nov | Dec | Jan | Feb | Mar | Apr | May | Jun |
|---|---|---|---|---|---|---|---|---|---|---|---|---|
| 2017 | ||||||||||||
| Breeding (BLA code) | 0 | 0 | 0 | 0 | 0 | 0 | 0 | 0 | 0 | 0 | 0 | 0 |
| Carrying Food | 0 | 0 | 0 | 0 | 0 | 0 | 0 | 0 | 0 | 0 | 0 | 0 |
| Copulating | 0 | 0 | 0 | 0 | 0 | 0 | 0 | 0 | 0 | 0 | 0 | 0 |
| Display | 0 | 0 | 0 | 0 | 0 | 0 | 0 | 0 | 0 | 0 | 0 | 0 |
| Dependent young | 0 | 0 | 0 | 0 | 0 | 0 | 0 | 0 | 0 | 0 | 0 | 0 |
| Faecal sac | 0 | 0 | 0 | 0 | 0 | 0 | 0 | 0 | 0 | 0 | 0 | 0 |
| Inspecting hollow | 0 | 0 | 0 | 0 | 0 | 0 | 0 | 0 | 0 | 0 | 0 | 0 |
| Nest building | 0 | 0 | 0 | 0 | 0 | 0 | 0 | 0 | 0 | 0 | 0 | 0 |
| Nest with eggs | 0 | 0 | 0 | 0 | 0 | 0 | 0 | 0 | 0 | 0 | 0 | 0 |
| Nest with young | 0 | 0 | 0 | 0 | 0 | 0 | 0 | 0 | 0 | 0 | 0 | 0 |
| On/leaving nest | 0 | 0 | 0 | 0 | 0 | 0 | 0 | 0 | 0 | 0 | 0 | 0 |
| All years | ||||||||||||
| Breeding (BLA code) | 0 | 0 | 0 | 0 | 0 | 1 | 0 | 0 | 0 | 0 | 0 | 0 |
| Carrying Food | 0 | 0 | 0 | 0 | 0 | 0 | 0 | 0 | 0 | 0 | 0 | 0 |
| Copulating | 0 | 0 | 0 | 0 | 0 | 0 | 0 | 0 | 0 | 0 | 0 | 0 |
| Display | 0 | 0 | 0 | 0 | 0 | 0 | 0 | 0 | 0 | 0 | 0 | 0 |
| Dependent young | 0 | 0 | 0 | 0 | 0 | 1 | 0 | 0 | 0 | 0 | 0 | 0 |
| Faecal sac | 0 | 0 | 0 | 0 | 0 | 0 | 0 | 0 | 0 | 0 | 0 | 0 |
| Inspecting hollow | 0 | 0 | 0 | 0 | 0 | 0 | 0 | 0 | 0 | 0 | 0 | 0 |
| Nest building | 0 | 0 | 0 | 0 | 0 | 0 | 0 | 0 | 0 | 0 | 0 | 0 |
| Nest with eggs | 0 | 0 | 0 | 0 | 1 | 0 | 0 | 0 | 0 | 0 | 0 | 0 |
| Nest with young | 0 | 0 | 0 | 0 | 1 | 0 | 0 | 0 | 0 | 0 | 0 | 0 |
| On/leaving nest | 0 | 0 | 2 | 4 | 2 | 1 | 0 | 0 | 0 | 0 | 0 | 0 |
Breeding records by year
Average number of breeding records per period by breeding code| Period | Breeding (BLA code) | Carrying Food | Copulating | Display | Dependent young | Faecal sac | Inspecting hollow | Nest building | Nest with eggs | Nest with young | On/leaving nest |
|---|---|---|---|---|---|---|---|---|---|---|---|
| All years | |||||||||||
| All | 0.0 | 0.0 | 0.0 | 0.0 | 0.0 | 0.0 | 0.0 | 0.0 | 0.0 | 0.0 | 0.2 |
| Previous years | |||||||||||
| All previous years | 0.0 | 0.0 | 0.0 | 0.0 | 0.0 | 0.0 | 0.0 | 0.0 | 0.0 | 0.0 | 0.3 |
| Previous 30 years | 0.0 | 0.0 | 0.0 | 0.0 | 0.0 | 0.0 | 0.0 | 0.0 | 0.0 | 0.0 | 0.3 |
| Previous 20 years | 0.0 | 0.0 | 0.0 | 0.0 | 0.0 | 0.0 | 0.0 | 0.0 | 0.0 | 0.0 | 0.0 |
| 10 year groups | |||||||||||
| [2007,2017) | 0.1 | 0.0 | 0.0 | 0.0 | 0.0 | 0.0 | 0.0 | 0.0 | 0.0 | 0.0 | 0.1 |
| [1997,2007) | 0.0 | 0.0 | 0.0 | 0.0 | 0.0 | 0.0 | 0.0 | 0.0 | 0.1 | 0.1 | 0.0 |
| [1987,1997) | 0.0 | 0.0 | 0.0 | 0.0 | 0.1 | 0.0 | 0.0 | 0.0 | 0.0 | 0.0 | 0.8 |
| 5 year groups | |||||||||||
| [2012,2017) | 0.2 | 0.0 | 0.0 | 0.0 | 0.0 | 0.0 | 0.0 | 0.0 | 0.0 | 0.0 | 0.2 |
| [2007,2012) | 0.0 | 0.0 | 0.0 | 0.0 | 0.0 | 0.0 | 0.0 | 0.0 | 0.0 | 0.0 | 0.0 |
| [2002,2007) | 0.0 | 0.0 | 0.0 | 0.0 | 0.0 | 0.0 | 0.0 | 0.0 | 0.0 | 0.0 | 0.0 |
| [1997,2002) | 0.0 | 0.0 | 0.0 | 0.0 | 0.0 | 0.0 | 0.0 | 0.0 | 0.2 | 0.2 | 0.0 |
| [1992,1997) | 0.0 | 0.0 | 0.0 | 0.0 | 0.2 | 0.0 | 0.0 | 0.0 | 0.0 | 0.0 | 1.6 |
| [1987,1992) | 0.0 | 0.0 | 0.0 | 0.0 | 0.0 | 0.0 | 0.0 | 0.0 | 0.0 | 0.0 | 0.0 |
| Year | |||||||||||
| 2017 | 0.0 | 0.0 | 0.0 | 0.0 | 0.0 | 0.0 | 0.0 | 0.0 | 0.0 | 0.0 | 0.0 |
| 2016 | 0.0 | 0.0 | 0.0 | 0.0 | 0.0 | 0.0 | 0.0 | 0.0 | 0.0 | 0.0 | 0.0 |
| 2015 | 0.0 | 0.0 | 0.0 | 0.0 | 0.0 | 0.0 | 0.0 | 0.0 | 0.0 | 0.0 | 0.0 |
| 2014 | 1.0 | 0.0 | 0.0 | 0.0 | 0.0 | 0.0 | 0.0 | 0.0 | 0.0 | 0.0 | 1.0 |
| 2013 | 0.0 | 0.0 | 0.0 | 0.0 | 0.0 | 0.0 | 0.0 | 0.0 | 0.0 | 0.0 | 0.0 |
| 2012 | 0.0 | 0.0 | 0.0 | 0.0 | 0.0 | 0.0 | 0.0 | 0.0 | 0.0 | 0.0 | 0.0 |
| 2011 | 0.0 | 0.0 | 0.0 | 0.0 | 0.0 | 0.0 | 0.0 | 0.0 | 0.0 | 0.0 | 0.0 |
| 2010 | 0.0 | 0.0 | 0.0 | 0.0 | 0.0 | 0.0 | 0.0 | 0.0 | 0.0 | 0.0 | 0.0 |
| 2009 | 0.0 | 0.0 | 0.0 | 0.0 | 0.0 | 0.0 | 0.0 | 0.0 | 0.0 | 0.0 | 0.0 |
| 2008 | 0.0 | 0.0 | 0.0 | 0.0 | 0.0 | 0.0 | 0.0 | 0.0 | 0.0 | 0.0 | 0.0 |
| 2007 | 0.0 | 0.0 | 0.0 | 0.0 | 0.0 | 0.0 | 0.0 | 0.0 | 0.0 | 0.0 | 0.0 |
| 2006 | 0.0 | 0.0 | 0.0 | 0.0 | 0.0 | 0.0 | 0.0 | 0.0 | 0.0 | 0.0 | 0.0 |
| 2005 | 0.0 | 0.0 | 0.0 | 0.0 | 0.0 | 0.0 | 0.0 | 0.0 | 0.0 | 0.0 | 0.0 |
| 2004 | 0.0 | 0.0 | 0.0 | 0.0 | 0.0 | 0.0 | 0.0 | 0.0 | 0.0 | 0.0 | 0.0 |
| 2003 | 0.0 | 0.0 | 0.0 | 0.0 | 0.0 | 0.0 | 0.0 | 0.0 | 0.0 | 0.0 | 0.0 |
| 2002 | 0.0 | 0.0 | 0.0 | 0.0 | 0.0 | 0.0 | 0.0 | 0.0 | 0.0 | 0.0 | 0.0 |
| 2001 | 0.0 | 0.0 | 0.0 | 0.0 | 0.0 | 0.0 | 0.0 | 0.0 | 0.0 | 0.0 | 0.0 |
| 2000 | 0.0 | 0.0 | 0.0 | 0.0 | 0.0 | 0.0 | 0.0 | 0.0 | 0.0 | 0.0 | 0.0 |
| 1999 | 0.0 | 0.0 | 0.0 | 0.0 | 0.0 | 0.0 | 0.0 | 0.0 | 0.0 | 0.0 | 0.0 |
| 1998 | 0.0 | 0.0 | 0.0 | 0.0 | 0.0 | 0.0 | 0.0 | 0.0 | 0.0 | 0.0 | 0.0 |
| 1997 | 0.0 | 0.0 | 0.0 | 0.0 | 0.0 | 0.0 | 0.0 | 0.0 | 1.0 | 1.0 | 0.0 |
| 1996 | 0.0 | 0.0 | 0.0 | 0.0 | 1.0 | 0.0 | 0.0 | 0.0 | 0.0 | 0.0 | 8.0 |
| 1995 | 0.0 | 0.0 | 0.0 | 0.0 | 0.0 | 0.0 | 0.0 | 0.0 | 0.0 | 0.0 | 0.0 |
| 1994 | 0.0 | 0.0 | 0.0 | 0.0 | 0.0 | 0.0 | 0.0 | 0.0 | 0.0 | 0.0 | 0.0 |
| 1993 | 0.0 | 0.0 | 0.0 | 0.0 | 0.0 | 0.0 | 0.0 | 0.0 | 0.0 | 0.0 | 0.0 |
| 1992 | 0.0 | 0.0 | 0.0 | 0.0 | 0.0 | 0.0 | 0.0 | 0.0 | 0.0 | 0.0 | 0.0 |
| 1991 | 0.0 | 0.0 | 0.0 | 0.0 | 0.0 | 0.0 | 0.0 | 0.0 | 0.0 | 0.0 | 0.0 |
| 1990 | 0.0 | 0.0 | 0.0 | 0.0 | 0.0 | 0.0 | 0.0 | 0.0 | 0.0 | 0.0 | 0.0 |
| 1989 | 0.0 | 0.0 | 0.0 | 0.0 | 0.0 | 0.0 | 0.0 | 0.0 | 0.0 | 0.0 | 0.0 |
| 1988 | 0.0 | 0.0 | 0.0 | 0.0 | 0.0 | 0.0 | 0.0 | 0.0 | 0.0 | 0.0 | 0.0 |
| 1987 | 0.0 | 0.0 | 0.0 | 0.0 | 0.0 | 0.0 | 0.0 | 0.0 | 0.0 | 0.0 | 0.0 |
| 1986 | 0.0 | 0.0 | 0.0 | 0.0 | 0.0 | 0.0 | 0.0 | 0.0 | 0.0 | 0.0 | 0.0 |
| 1985 | 0.0 | 0.0 | 0.0 | 0.0 | 0.0 | 0.0 | 0.0 | 0.0 | 0.0 | 0.0 | 0.0 |
| 1984 | 0.0 | 0.0 | 0.0 | 0.0 | 0.0 | 0.0 | 0.0 | 0.0 | 0.0 | 0.0 | 0.0 |
| 1983 | 0.0 | 0.0 | 0.0 | 0.0 | 0.0 | 0.0 | 0.0 | 0.0 | 0.0 | 0.0 | 0.0 |
| 1982 | 0.0 | 0.0 | 0.0 | 0.0 | 0.0 | 0.0 | 0.0 | 0.0 | 0.0 | 0.0 | 0.0 |
Distribution map
Distribution - 2017
This map shows the observed distribution of the White-necked Heron for 2017.
The red circles are the grid cells where White-necked Heron have been reported.
The transparency of the red circles indicate how many surveys sheets were submitted for that grid cell; the darker the red the more reliable the data. Of the 315 grid cells with reports, 83 had only one sheet; an example is grid number G6.
The size of the circle represents the reporting rate. The maximum reporting rate for White-necked Heron was 100.0% (eg grid number G6) and the minimum was 0.1% (eg grid number K15). 
Distribution - all years
This map shows the observed distribution of the White-necked Heron for all years.
The red circles are the grid cells where White-necked Heron have been reported.
The transparency of the red circles indicate how many surveys sheets were submitted for that grid cell; the darker the red the more reliable the data. Of the 703 grid cells with reports, 55 had only one sheet; an example is grid number S27.
The size of the circle represents the reporting rate. The maximum reporting rate for White-necked Heron was 100.0% (eg grid number S27) and the minimum was 0.0% (eg grid number K15). 
Breeding map
Breeding - 2017
This map shows the breeding distribution of the White-necked Heron for 2017.
The red circles are the grid cells where breeding activity for White-necked Heron have been reported.
The size of the circle represents the number of reports. 
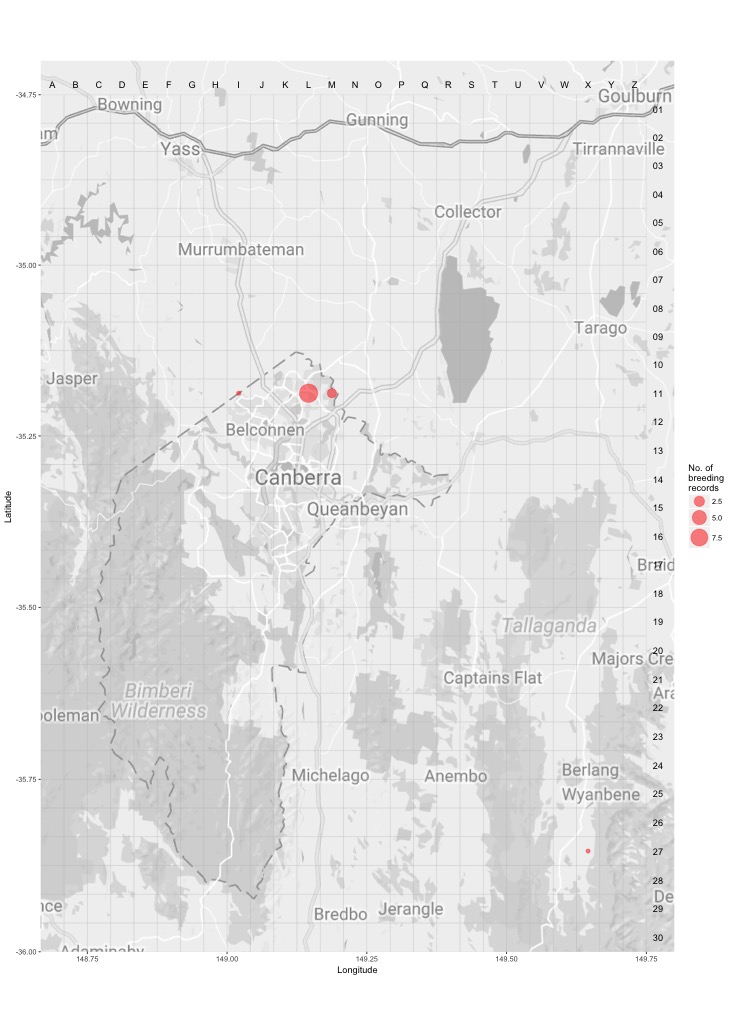
Breeding - all years
This map shows the breeding distribution of the White-necked Heron for all years.
The red circles are the grid cells where breeding activity for White-necked Heron have been reported.
The size of the circle represents the number of reports.